The 3d graph layout extension is an exploratory project based on Gephi toolkit to easily build, save, load, layout, and draw 3d graphs.
Layouts
As Gephi data model already holds 3 dimensions for node coordinates, it is easy to port existing layouts to 3d.
This extension provides 3 Gephi compatible layouts:
- Force Atlas 3d
is based on Mathieu Jacomy's algorithm. Both version 1 & 2 are available as 3d layouts.
- OpenOrd 3d is an efficient layout for large graphs based on Mathieu Bastian's implementation.
|
Requirements
The graph eclipe project is linked to the core api project to remain up to date with master.
To work with the API sources and examples, you will have to checkout the two projects on Github.
Maturity - Prototype
At this stage, the project provides working 3d layouts, and shows how to run them with in a simple Jzy3d chart.
Graph charts may be improved as follow:
- Single colored edges make hard to understand the volume of a graph. Coloring clusters or path will provide visual reference points helping to visualize the graph' structure.
- Node labeling is implemented but obfuscate graphs. Mouse sensitive tooltips can enhance graph readability.
- Jzy3d zoom & pan model work as follow: turning around a shape, and changing its Z scale with mouse wheel or keyboard.
This is not what we need for exploring graphs. We most probably need to be able to be inside the graph and look at a couple of nodes. Exploring also means being able to access several local views easily. Implementing a bring and go explorer may be worth.
- Caching layout results will let you gain lot of time developping the graphical part of your application :)
There are might be other interesting approaches of using the third dimension:
- Stacking several 2d graphs with a common layout to see how the node and edge properties (size, color) evolve over time at one glance
- Let (X,Y) be fixed by an existing 2d algorithm, and compute Z according to a node attribute's value. Changing top 2d view to profile view would immediatly display categories of nodes according to their attribute value.
This extension has been tested on Ubuntu 12 and Windows 7, and has no particular component that should not be able to run on Mac OSX.
|
Code example
public static void main(String[] args){
// initialize graph controller
GephiController controller = new GephiController();
controller.init();
// generate graph
GephiGraphGenerator generator = new GephiGraphGenerator();
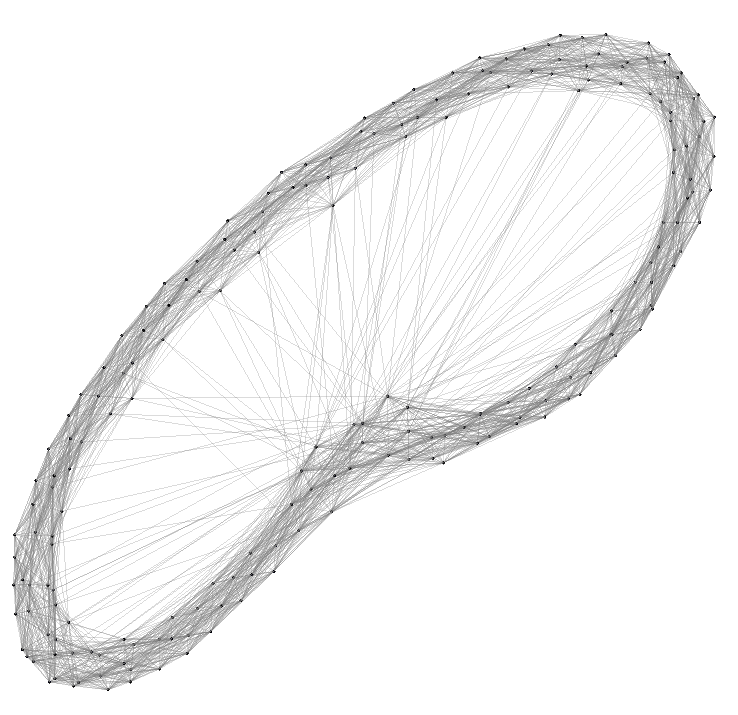
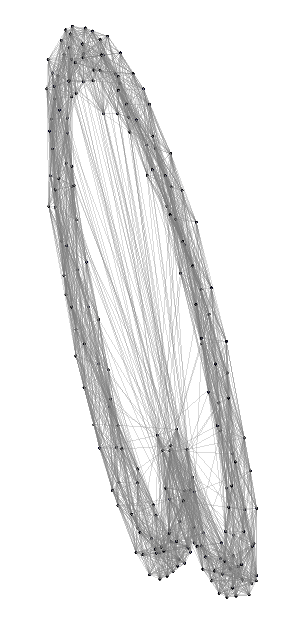
generator.wattsStrogatz(w, 200, 15, 0.05);
controller.save(new File("./data/watts.graphml").getAbsolutePath());
// layout
GraphModel g = controller.getGraph();
controller.randomizeGraphLayout(g);
Layout layout = GephiLayoutFactory.createForceAtlas2_3d(g);
// renderer
GraphRendererSettings settings = new GraphRendererSettings();
settings.setNodeLabelDisplayed(false);
settings.setNodeSphereDisplayed(true);
settings.setNodePointDisplayed(false);
GraphRenderer representation = GraphRenderer.create(g, settings);
representation.getGraph().setAxeDisplayed(false);
representation.openChart();
// runner
GephiLayoutRunner runner = new GephiLayoutRunner();
runner.run(layout, LAYOUT_STEPS, representation);
}
|
|
* so sad, no time to participate...
Other extensions
|

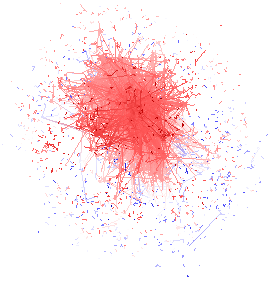
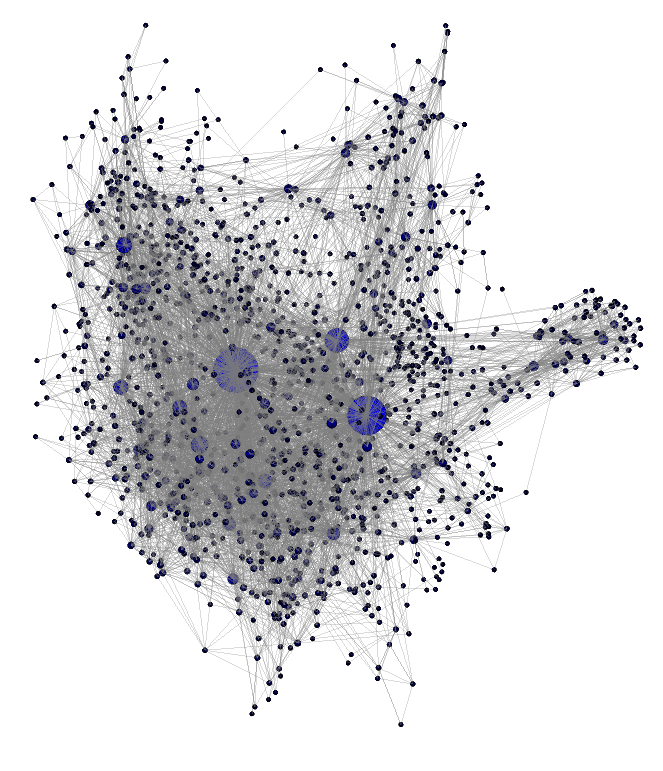 ForceAtlas 3d layout - 1538 nodes 8032 edges - ~10 min