 | Downloads | Documentation | Community | Gallery | Extensions |
|
New features in 2.0.02021, 20th MarchEmulGL & refactoring of the drawing object model
A new CPU-based OpenGL renderer is born, providing an enhanced portability. Traditional GPU rendering offers great performance
but sometimes hit a compatibility issue for some rare {OS, JDK, GPU} combination. EmulGL processes the 3D scene inside the
JVM only with rendering time below 40ms for most surface and scatter charts.
EmulGL uses jGL, a pure Java implementation of the OpenGL 1 specification.
EmulGL remains relevant for simple charts. Native charts (using JOGL) remain the preferred option for fast rendering of
very large geometries, volumes or rendering involving shaders.
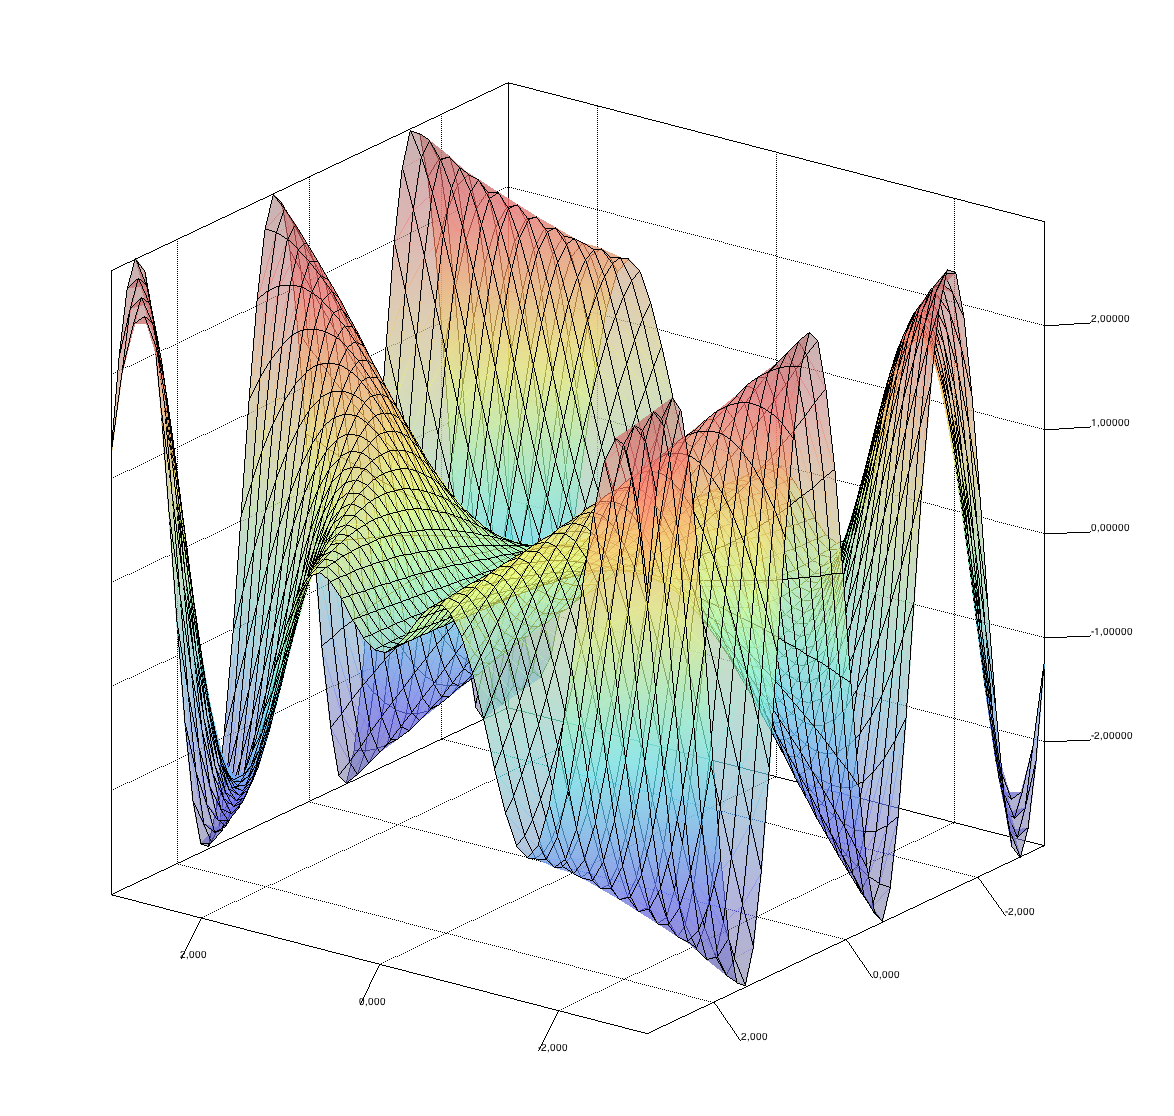
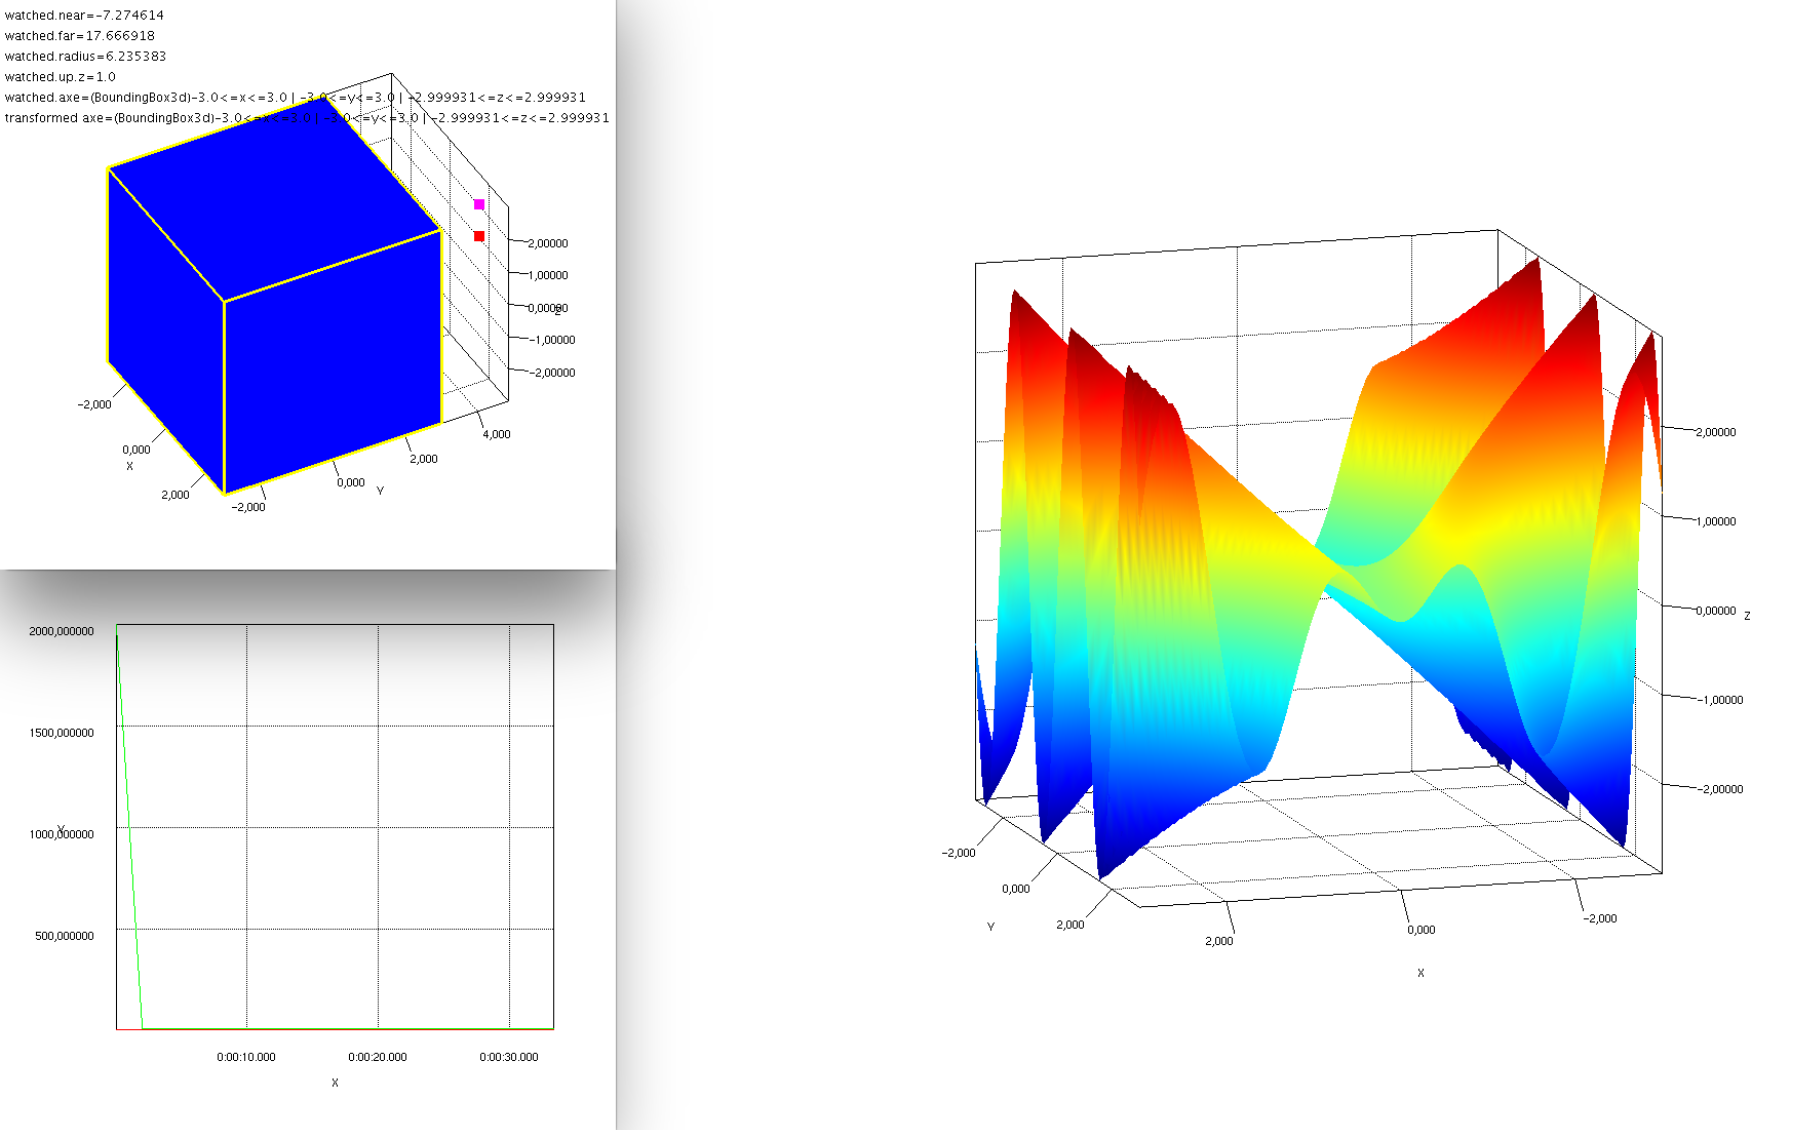
Chart testsMaking big changes in the framework required more test tools to ensure non regression.
Volume chartsViewing volume is now possible in Jzy3d thanks to a great contribution of Jacob Filik from Diamond Light Source. The below chart is demonstrated in the tutorial module. 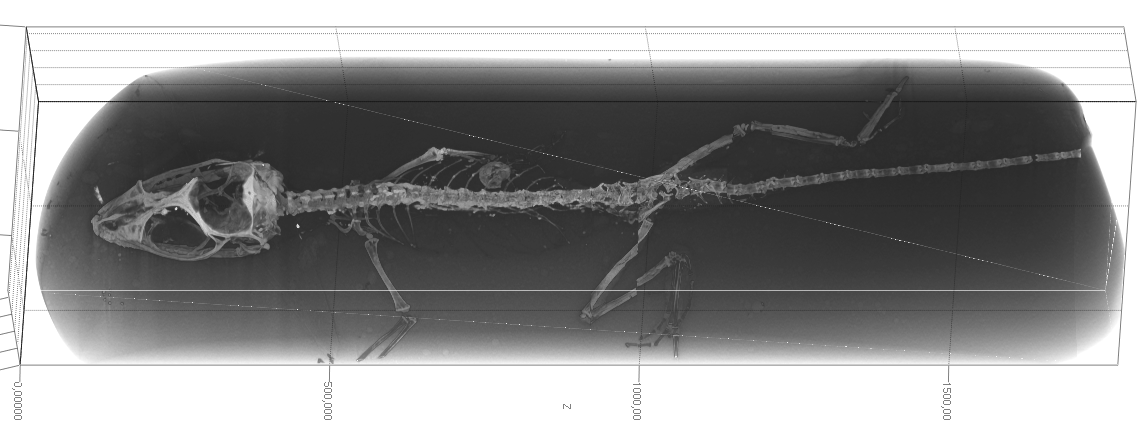
Text customizationIt is now possible to customize text renderers with any java.awt.Font 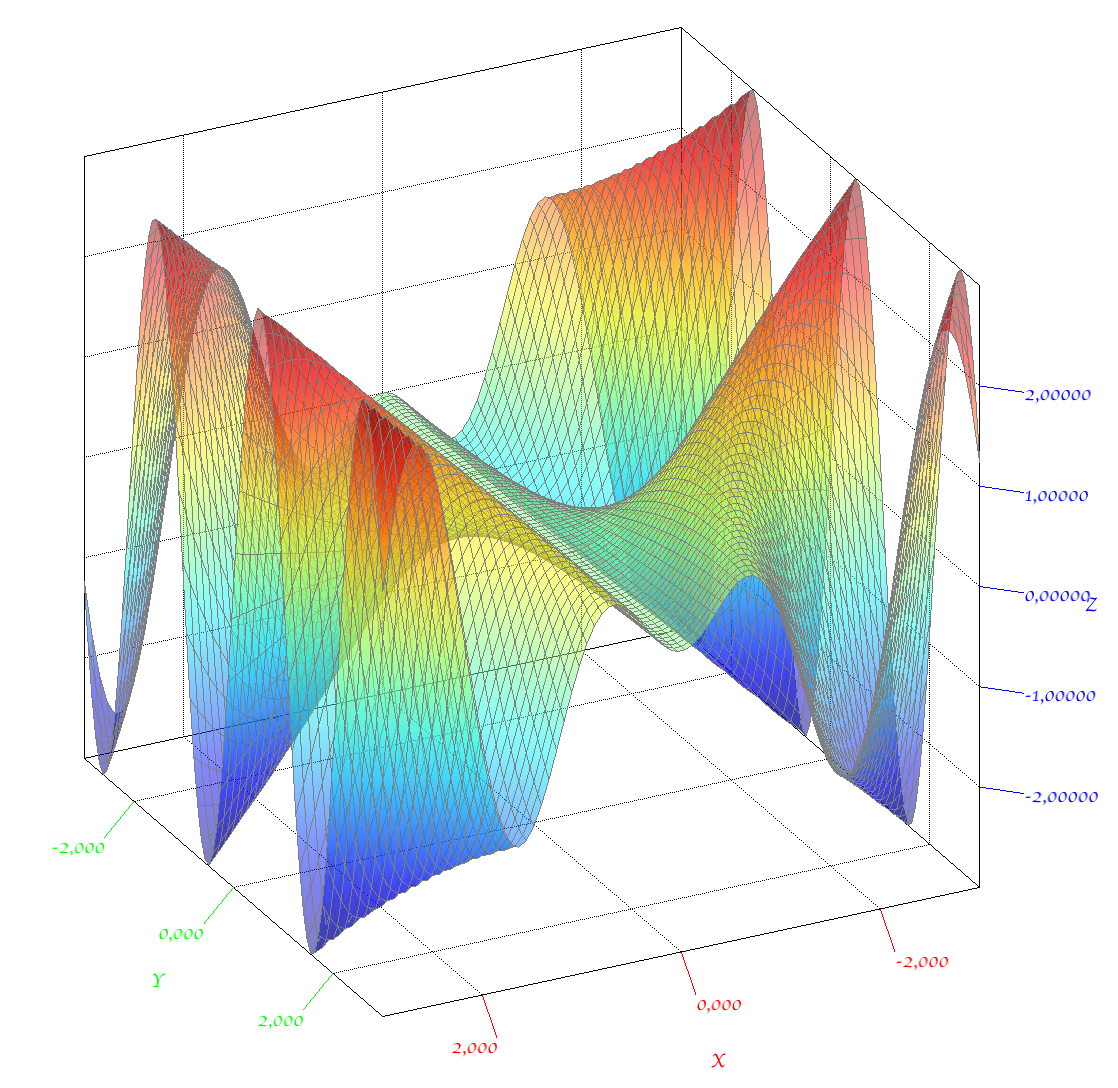
Fast sphere renderingSphereVBO object allows rendering efficiently a high number of sphere, hence allowing to create 4D scatter plots. 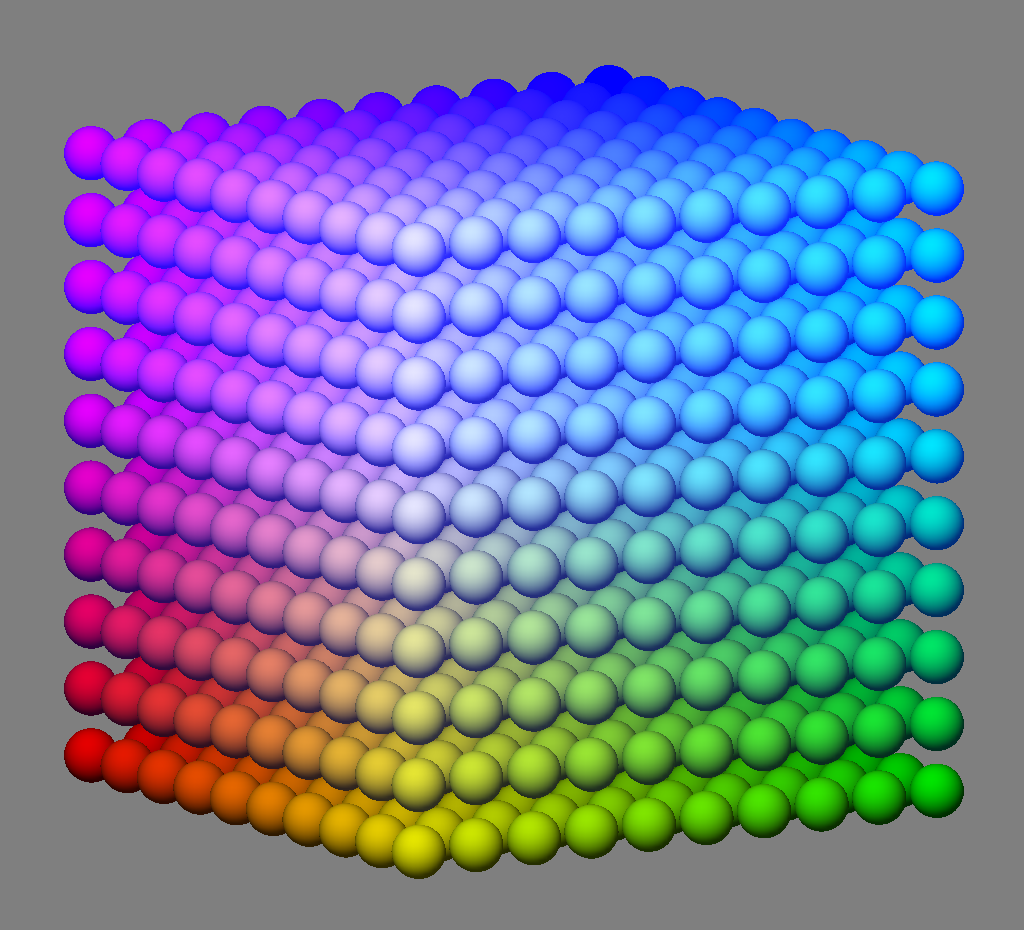
Tutorials and documentation improvements
Tutorials have a better focus on
portability demonstration
(showing examples of AWT, SWT, Swing, EmulGL, etc). We also added
examples of building 2D charts with Jzy3d.
Improvements in previous versionsThe following features were not claimed through the usual download pages but remain tagged on github branches (maven build also deployed). Jzy3d 1.0.2
Downloading the jarsJzy3d Maven repository
As of 2.0.0, Jzy3d artifacts have been splitted to be able to distinguish core java classes, native GL implementations, emulated GL implementation.
Manual downloadYou can download jars manually from the Maven repositories :Documentation
|
|